Data Unlocked

Bringing data to life

  • Home
  • About
  • Projects
  • Blog
  • Contact

How to Estimate the diagnosis of health conditions in England

September 10, 2018 By Mike Cummins Leave a Comment

Simon has explained what we wanted to do with QOF in the previous post.

Looking at the prevalence data from the QOF files, we see the GP Code, the Indicator Group (the health condition this relates to), the number of patients on that GP’s register that have that condition, the list type and list size.

These last two fields are important – not all conditions are measured across all ages: in the example below, Chronic Kidney Disease is only counted for people over 18.

gp_code Indicator_group register patient_list_type list_size
AGP001 AF 100 TOTAL 1000
AGP001 AST 300 TOTAL 1000
AGP001 CKD 125 18OV 800

Continue Reading

Google Maps

March 12, 2018 By Mike Cummins Leave a Comment

I recently wanted to present crime data for Moseley on a map – something I would normally do in Tableau, but wasn’t convenient at the time.

Having visited police.uk, entered a Moseley postcode and clicked “Explore the crime map”, I downloaded the data for the previous year to date by clicking “View detailed statistics and choosing the option to “download crime data for this area as a CSV file”.

I now had a file and remembered that an infrequently used part of Google Maps is to create your own map, albeit with a limit of 2,000 features.

–read more —

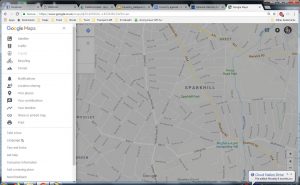
Having signed into Google, I went to Google Maps and clicked the 3 parallel horizontal bars that indicate a submenu.

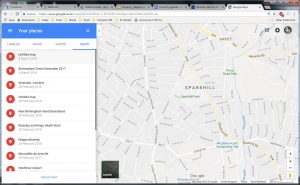
By clicking “Your places”, I was presented with maps that I had created in the past:

At the bottom of the list, there is an option to “CREATE MAP”, which I selected.

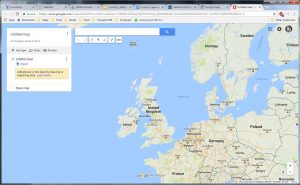
A clue is given to Import data onto a new (untitled) layer, which I selected.

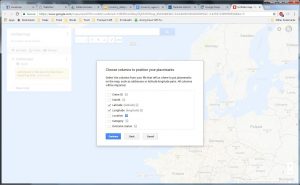
I uploaded my Moseley Crime Data to be asked which columns contained the Latitude and Longitude.  Fortunately, these columns had the same name and where already selected, so I clicked “Continue”.

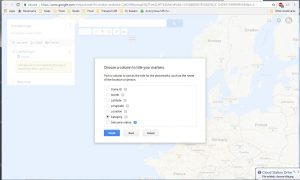
I was now asked to select a column to use as titles for my markers, selecting Category.

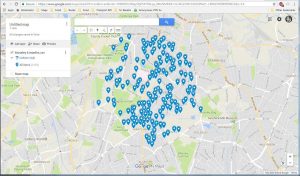
On clicking Finish I was presented with my map:

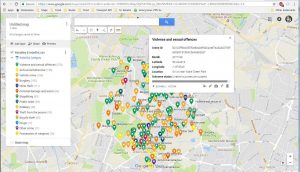
This is a bit boring, so I chose “Uniform style” and selected “Category which colour coded the pins by crime category:

So a quick and dirty colour coded map in about 3 minutes.


Birmingham’s Rubbish

February 5, 2016 By Mike Cummins Leave a Comment

Birmingham City Council recently announced that they would be “opening up the council’s vast amounts of data, so members of the public can judge our performance.”

Their first offering is a “a dashboard that outlines how well each ward is doing on some key environmental measures: litter, fly-posting and graffiti.”. This is the form of an Excel spreadsheet with a red background for those wards failing the target and a green background for those that match or better it.

The dashboard can be seen at FWM-Dashboard-1-Feb-2016.xls. Interestingly, this is not in the Open Data section of the BCC website, but a Newsroom announcement. The last place I looked…

Data for the first three maps is for February 2016. Index of Multiple Deprivation is for October 2015.

Litter

Flyposting

Graffiti

Indices of Multiple Deprivation (Red to Green)

The Balkanisation of Data

July 31, 2015 By Mike Cummins Leave a Comment

As regular readers of this blog will know, I have recently been trying to get historical data for the West Midlands primarily prompted by the National Trust app [https://www.nationaltrust.org.uk/visit/places/find-a-place-to-visit/mobile-apps/] crashing whenever I try and use it (on multiple Android devices).

I was also somewhat interested in the data that Historic England [http://www.historicengland.org.uk/listing/the-list] (English Heritage as was) provided as a supplementary source of information for any app that I developed.

I approached the National Trust (henceforth NT) to receive the following reply:

“I’m sorry but we don’t hold a full listing of our places, the only info we have is what is currently available on the Land Map.”.

Astonishing. Unfortunately, as the National Trust is a charity, they do not need to submit to FOI requests, so I next looked at Wikidata. This only contains 332 out of 525 NT properties – at least under the name used by the National Trust…

In the mean time I had been in contact with Historic England and received two files, which I merged but when I tried to combine the NT places with the HE data I found that NONE of my data matched. I was missing the NT data from the HE file(s).

As a new avenue I decided to try and get the data for the Heritage Environment Records (the Sites and Monuments Records [https://en.wikipedia.org/wiki/Sites_and_monuments_record] as was) and found the gateway at http://www.heritagegateway.org.uk/Gateway/CHR/. Responsibility is the held (mainly) by the Local Authority, so for the West Midlands I would need to combine data from Birmingham, Coventry, Dudley, Herefordshire, Sandwell, Shropshire, Solihull, Staffordshire, Stoke-on-Trent, Warwickshire, Wolverhampton, Walsall,
Worcester City, and Worcestershire.

So a mere 17 sources of information – just for the West Midlands. I find it astonishing that there is no single place this is held. I feel a project coming on…

Ask nicely!

June 26, 2015 By Mike Cummins Leave a Comment

Simon and I have had a busy couple of days presenting the “Realising the value of data” sessions at the Greater Birmingham Digital Academy Summer School where we explained some of the different ways you can get data from organisations, to which I added this one.

I have a long standing passion for historic buildings and was interested to find that Historic England (English Heritage, as was) provide a data download. I grabbed this (see my previous post) , but was somewhat frustrated to find that the Asset Name was (no doubt due to “historic” reasons) sometimes something like “2-3”.  Although an Easting and Northing was also supplied, I couldn’t think of an easy way to convert those to an address.

I emailed them to ask if any further information was available and, somewhat to my surprise, their Mapping and Spatial Analysis Officer replied to me. After a bit of discussion, he agreed to do an extract for the West Midlands and the following day I received two files containing a lot more data.

A swift merge using Google Fusion Tables, and I had a file that already had the Latitude and Longitude and contained much better data.

The moral is “Ask nicely”.


Listed Buildings

June 4, 2015 By Mike Cummins Leave a Comment

I recently downloaded the Android National Trust app and was disappointed in it in several respects.

It was difficult to use the map to find somewhere to visit, requiring several zoom operations before you can select a place. Unfortunately, once you have got that far, the app crashes.

This lead me to thinking of writing my own app but, as The National Trust is a charity, they are not required to publish data and do not do so. Whilst I am in the process of extracting the data from Wikidata, I thought I would have a look at Listed Buildings. There are a lot of them.


Creating and using embedded maps

August 11, 2014 By Mike Cummins Leave a Comment

This post will show you how to use Google Fusion Tables to create a map that can be embedded into your website.

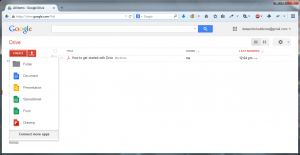
Log in to Google Docs and click the Create button:
Click Create

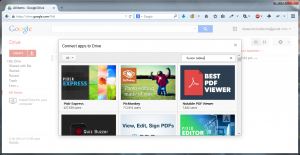
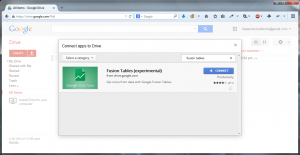
Click “Connect more apps” at the bottom of the pop up and in the Search box type “Fusion Tables”:

connect more apps

Hit enter:
connect

Click Connect and then click OK.

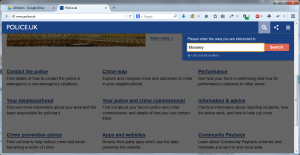
Open a new browser window and go to http://www.police.uk. Look for and click Crime Map then, when prompted, enter the area or postcode you are interested in:

Area Moseley

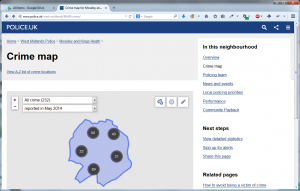
On the following screen choose “View detailed statistics” on the right hand side:
View details statistics

Click “Download crime data for this area as a CSV file” and save the file somewhere you will remember.

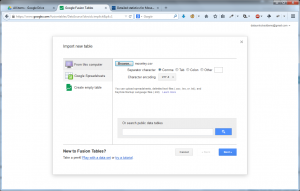
Go back to Google Docs, click the Create button and then Fusion Tables. Click Browse and select your file:
browse

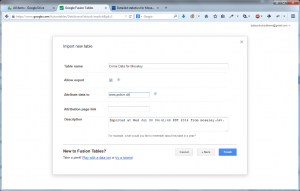
Then click Next. Depending on the size of your file, this may take some time but eventually a table will be presented. Check that the columns look correct and click Next.import new table

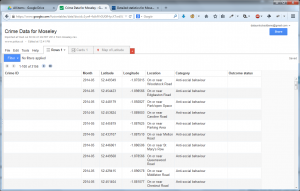
Now is a good time to give a proper name to your project then click Finish. You will be presented with a screen similar to this:
fusion table

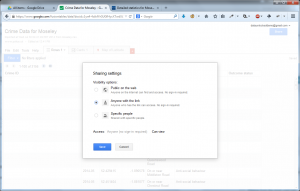
Click the “Share” button on the top right, and choose “Anyone who has the link can view“.


visibility

Click Save, then Done.

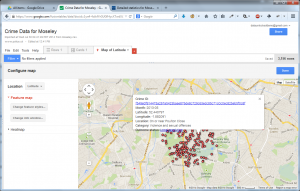
Click the Map of Latitude tab and check that the data seems to be OK:
map

There are several things you can do now from choose what is displayed in the pop-up when you select a red dot to changing the red dot to something else. Explore.

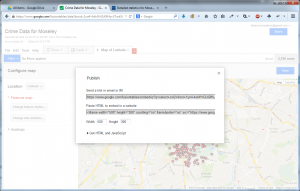
When you have finished, click Tools then Publish:
publish

Change the height and width, then copy the part that starts “<iframe width=” to the clipboard.

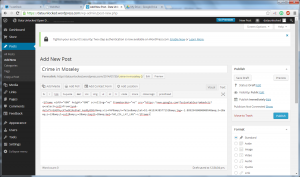
Go to your favourite Content Management System – I am using WordPress.com as an example – and create a new post. Select the Text button, and paste in the “<iframe…” content you previously copied:
crime

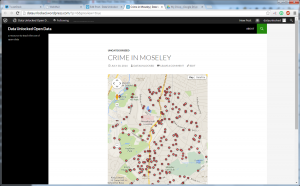
Save your draft and click Preview:

preview


A Modest Proposal for an API to query planning data

July 14, 2014 By Mike Cummins 8 Comments

We have recently been looking at Planning Application data and how it could best be accessed by programmers to create their own displays or to create plug-ins for Word Press etc.

As such, this is a sort of Request For Comments to find out if we are thinking on the right lines and whether we have missed any vital functionality.

An API implemented as a standard JSON web service using HTTP GET and POST requests.

Last Application:

eg /api/api.php?lastapplication

Returns :

{
   "Date": "2014-03-31"
}

Authorities held
eg /api/authorities

Returns :

[
{
   "Authority": "Birmingham",
   "Count": 2567
},
...
]

By Application number

eg /api/api.php?Birmingham&application=2014/01632/PAContinue Reading

Talking Open Data at #VCSSCamp

June 26, 2014 By Mike Cummins 1 Comment

I attended #VCSSCAMP – for people from VCS Local Infrastructure Organisations across the country to meet [that’s CVSs and Volunteer Centres etc] and what a bunch of enthusiastic people they are.

I was reminded by Nick Booth of just how important it is to tell people what you are doing now, not what you did or are going to do, thus this post[1].

There were several great sessions (look up the #hashtag or view the storify [to follow]), but I became most animated during the Open Data session – no surprise there.  This session had two main threads, the first detailing the sorts of things that can be done when you mix and match data that is open (I used the example of Birmingham Council spending over £500 to the Open Corporates data – including turnover) and a few more were mentioned that to prevent red faces on the targets I won’t mention.  The second thread was on how sharing your data can bring unforeseen benefits from people producing apps and mash-ups (linking the data in interested ways) to finding links to organisations that you would, at first thought, not have expected to be relevant.

A possible third thread nearly appeared – where do we find out how to do this? A topic that was touched on several times and specific questions were answered which (as the participants were so polite) were not really followed up. The ODI were mentioned, but not everyone can go to London to attend their events.  Those in the know did mention the West Midlands Open Data Forum, Open Mercia, the projects in Leeds, Manchester and Bristol but these are not really learn-how, more learn-with.

That said, this seems to be a recurrent theme across a lot of (un and) conferences I have been to recently and I normally answer with “There are a lot of tutorials out there” which is a non-answer. You would need to know what is possible, and what search terms to use, before you know how to find the tutorial.

Paul Bradshaw has done an excellent job with Hacks and Hackers of mixing people who want to know with people who know and I wonder if this system could or should be replicated outside of journalism to a wider audience – not just VCS but housing associations, uniformed groups (Scouts, St. John’s Ambulance etc) and others.

This leads me to wonder if there would be an appetite for an “Open Data 101” – what is Open Data, how do I use it and (hopefully) how do I open my data.  If there is enough interest, I would be willing to see if anyone (maybe RnR , the ODI or even Data Unlocked) could put something together in your area. This would (ideally) be from [boring] “I know nothing” to [fascinating] “Hey! Who knew?” over a series and would maybe involve setting something like a hangout up (Google+) to enable the participants to help each other as they explore their new skills. Maybe bring in people like Paul Bradshaw, Dave Harte and Nick Booth who can explain how to turn your wow-factor into something that a local paper will use…

*1 I would like to blame coffee for this blog post, but it is probably more the enthusiasm hormones from today.

West Midlands European Elections 2014

June 3, 2014 By Mike Cummins 1 Comment

Last week we collected and visualised the data for the local elections. To be complete, we have now scraped the European election results and made a Tableau visualisation of them.

The electoral process is different for the European Elections, as it is a form of Proportional Representation. Also, the results are more widely scattered on the map, this makes it more difficult to visualise and I think this makes it less clear than the Local Elections.

One thing I’ve added is a table showing the percentage of the vote per party for each of the electoral areas on the map. Because the numbers of people voting varies so much across areas this table is probably the best for seeing where particular parties are strongest. See if you can guess where UKIP got the highest proportion of votes in the West Midlands…..

If I get time, it would be nice to code the maps with LeafletJS as it has better panning. If you click and hold on the map below for a couple of seconds you will, eventually, be able to move the map around.

As for the local elections, the raw data is stored in the Open Data West Midlands Store.

Learn About Tableau
Next Page »

Contact Us

Many of our clients come to us with the words "there must be a way this can be done . . ."

We have found that there usually is!

Whether you have a problem that needs solving, or you just want to talk through some ideas, please get in touch.

Data Unlocked believes that a more equal society is a better society. We especially aim to work on projects that provide information to people and groups who might not usually be able to access it, so we are particularly interested in working with people who share these aims.

We are based in Birmingham, UK, but work nationally and internationally.

Email: hello@dataunlocked.co.uk

Twitter: @dataunlocked

Featured Project

Schools Finder

Our schools admission tool brings information together to enable parents and carers to make better choices.

Read more about this and other projects . . .

Copyright © 2025 Data Unlocked · Map Image Copyright © OpenStreetMap contributors · Website by Fresh Eyes Consultancy