Data Unlocked

Bringing data to life

  • Home
  • About
  • Projects
  • Blog
  • Contact

How to Estimate the diagnosis of health conditions in England

September 10, 2018 By Mike Cummins Leave a Comment

Simon has explained what we wanted to do with QOF in the previous post.

Looking at the prevalence data from the QOF files, we see the GP Code, the Indicator Group (the health condition this relates to), the number of patients on that GP’s register that have that condition, the list type and list size.

These last two fields are important – not all conditions are measured across all ages: in the example below, Chronic Kidney Disease is only counted for people over 18.

gp_code Indicator_group register patient_list_type list_size
AGP001 AF 100 TOTAL 1000
AGP001 AST 300 TOTAL 1000
AGP001 CKD 125 18OV 800

Continue Reading

Estimating the diagnosis of health conditions in England

September 4, 2018 By Simon Whitehouse 1 Comment

Data Unlocked are working on a project with Inside Outcomes and Birmingham City University to estimate the rate of diagnosis of over twenty health conditions in England using openly available datasets. In this blog post Simon Whitehouse explains how we have made our estimations.

Earlier this year we spoke with Darren Wright of Inside Outcomes about the possibility of estimating the diagnosis of health conditions in England by area, something we were surprised wasn’t already available.

The National Health Service (NHS) do produce statistics, called Quality Outcome Framework (QOF) measures, that break down the prevalence of diagnosis of twenty five different health conditions from Atrial Fibrillation to Stroke, by GP practice.

Pre-Existing Condition - The Noun Project

They also produce statistics about the number of patients registered in GPs practices, broken down by the Lower Layer Super Output Area (LSOA) they live in.Continue Reading

Google Maps

March 12, 2018 By Mike Cummins Leave a Comment

I recently wanted to present crime data for Moseley on a map – something I would normally do in Tableau, but wasn’t convenient at the time.

Having visited police.uk, entered a Moseley postcode and clicked “Explore the crime map”, I downloaded the data for the previous year to date by clicking “View detailed statistics and choosing the option to “download crime data for this area as a CSV file”.

I now had a file and remembered that an infrequently used part of Google Maps is to create your own map, albeit with a limit of 2,000 features.

–read more —

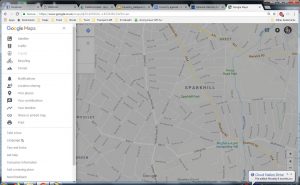
Having signed into Google, I went to Google Maps and clicked the 3 parallel horizontal bars that indicate a submenu.

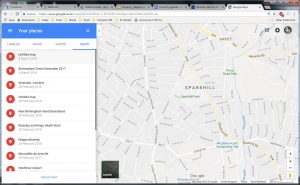
By clicking “Your places”, I was presented with maps that I had created in the past:

At the bottom of the list, there is an option to “CREATE MAP”, which I selected.

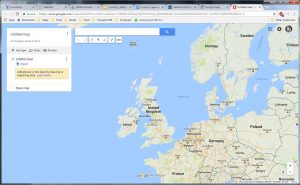
A clue is given to Import data onto a new (untitled) layer, which I selected.

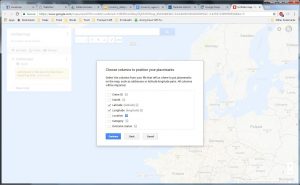
I uploaded my Moseley Crime Data to be asked which columns contained the Latitude and Longitude.  Fortunately, these columns had the same name and where already selected, so I clicked “Continue”.

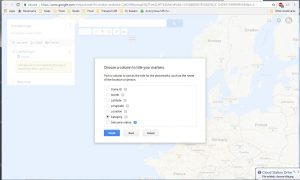
I was now asked to select a column to use as titles for my markers, selecting Category.

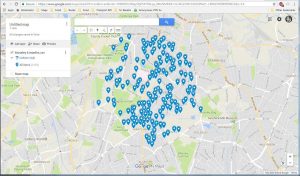
On clicking Finish I was presented with my map:

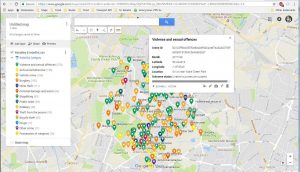
This is a bit boring, so I chose “Uniform style” and selected “Category which colour coded the pins by crime category:

So a quick and dirty colour coded map in about 3 minutes.


Discussing council budgets at UK Gov Camp

January 23, 2018 By Simon Whitehouse Leave a Comment

UKGovCamp Word Cloud

UKGovCamp 2018

Last Saturday I attended UK Gov Camp – an event for people interested in how the public sector makes the best uses of digital technologies. It has an open format, with the agenda decided by the participants. At the start of the day everyone has the chance to stand up and “pitch” their idea for a session.

Data Unlocked are going to be data partners for The Bureau Local‘s Big Council Budget Hack which is happening at five centres around the country on Saturday, 3rd February. So, I pitched a session to discuss council budgets and what attendees thought would be useful information for members of the public and journalists attending the hack day.

180120-1044_23C2758.jpg

The raw session notes were taken by Graeme Jones from OpenMindly. I have adapted them below to include my thoughts and to focus on just three questions that were raised.Continue Reading

The Big Council Budget Hack – West Midlands

January 19, 2018 By Simon Whitehouse Leave a Comment

We are very happy to announce that we will be The Bureau Local’s data partners for their Big Council Budget Hack – West Midlands event on Saturday 3rd February at Coventry University’s Ellen Terry Building.

This Bureau Local investigation “is bringing together budget data for each of England’s 353 councils to find out what makes the cut – and what doesn’t – ahead of the government’s next set of funding decisions in March.”

The Big Council Budget Hack - West Midlands with Bureau Local

The Big Council Budget Hack – West Midlands

Open Data Manchester have the onerous task of completing a technical review of all the data beforehand. We will be on hand at the Coventry event to help people explore the data and find the answers to any questions they might have.

The sign up is on Eventbrite. If you are coming along and already know what you are interested in then please let us know in the comments and we will try and do some preparatory work beforehand.

Who Owns Birmingham? – December Event

December 15, 2017 By Simon Whitehouse 4 Comments


Image by West Midlands Police (Flickr: Can you identify this aerial shot?) [CC BY-SA 2.0 (https://creativecommons.org/licenses/by-sa/2.0)], via Wikimedia Commons

Image by West Midlands Police (Flickr: Can you identify this aerial shot?) [CC BY-SA 2.0 (https://creativecommons.org/licenses/by-sa/2.0)], via Wikimedia Commons

Who owns small, unloved pockets of land in Birmingham’s inner city? Why are so many properties owned by companies located at one address on Jersey? Where’s the most expensive car parking space in England and Wales?  Are there a significant number of overseas companies owning land in England and Wales who also appear in the Panama and Paradise Papers?
These were just a few of the questions explored this Tuesday, 12th December by people and groups at Data Unlocked’s Who Owns Birmingham event.

This Tuesday we held our first Who Owns Birmingham event at Innovation Birmingham. This follows the Land Registry’s recent release of data about land and property ownership in England and Wales.

The release includes a little over three and a half million records of land and property in England and Wales owned by companies, local authorities, county councils and other organisations. Private individuals and charities are the two categories not published.Continue Reading

Land Registry Open Data Release

December 8, 2017 By Simon Whitehouse Leave a Comment


Land Registry by Jonathon Rolande from Pixabay

At the start of November the Land Registry released data about corporate and overseas property ownership in England and Wales. In all there are roughly three and a half million rows of data about commercial and corporate property ownership and a little under one hundred thousand rows of data on overseas property ownership.

That’s a lot of data and we think there are bound to be some interesting stories in there.

What have we done?

Continue Reading

Open Data Camp – Data as Art session

November 2, 2017 By Simon Whitehouse Leave a Comment

Of all the people in the world - Stan's Cafe - Two Snowhill

Myself and Mike Cummins went to Belfast the other weekend for Open Data Camp 5. The following is a write up and some thoughts about the session that Amy Evans from Open Data Institute (ODI) Leeds ran on Open Data and Art.

The Session: Open Data As Art

Amy started by introducing herself. She is the social media and communications lead at ODI Leeds as well as being their go to person for visual work. She has a background in Visual Communication, specifically Illustration.

Amy highlighted the Big Bang Data exhibition at Somerset House as being an example of open data art and said that her interest in running the session was to discover other examples.Continue Reading

Open Data Standards – School Admissions

October 20, 2017 By Simon Whitehouse Leave a Comment

Birmingham School Finder

Data Unlocked have long had our Schools Finder project that aims to improve the school admissions process here in Birmingham.

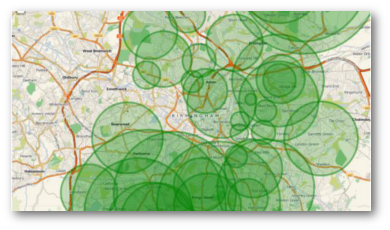
It allows you to put your address or post code in and from that it will create a map showing the cut off distances for schools in your area over the previous years. While it can’t tell you for definite that you will or won’t be successful, it helps parents and carers in their decision making by giving an indication of recent trends.

We are currently updating the Birmingham School Finder, so apologies for not being able to link to a live example, our current working copy has data up to 2014 and includes historic trends. It covers both primary and secondary school admissions.

Birmingham-Secondary-Schools-Finder

As part of this work we have written a series of Freedom of Information (FoI) requests. We did this after reading and using a fair few local authority school admission documents, comparing the information they contained.Continue Reading

Birmingham’s Rubbish

February 5, 2016 By Mike Cummins Leave a Comment

Birmingham City Council recently announced that they would be “opening up the council’s vast amounts of data, so members of the public can judge our performance.”

Their first offering is a “a dashboard that outlines how well each ward is doing on some key environmental measures: litter, fly-posting and graffiti.”. This is the form of an Excel spreadsheet with a red background for those wards failing the target and a green background for those that match or better it.

The dashboard can be seen at FWM-Dashboard-1-Feb-2016.xls. Interestingly, this is not in the Open Data section of the BCC website, but a Newsroom announcement. The last place I looked…

Data for the first three maps is for February 2016. Index of Multiple Deprivation is for October 2015.

Litter

Flyposting

Graffiti

Indices of Multiple Deprivation (Red to Green)

Next Page »

Contact Us

Many of our clients come to us with the words "there must be a way this can be done . . ."

We have found that there usually is!

Whether you have a problem that needs solving, or you just want to talk through some ideas, please get in touch.

Data Unlocked believes that a more equal society is a better society. We especially aim to work on projects that provide information to people and groups who might not usually be able to access it, so we are particularly interested in working with people who share these aims.

We are based in Birmingham, UK, but work nationally and internationally.

Email: hello@dataunlocked.co.uk

Twitter: @dataunlocked

Featured Project

Schools Finder

Our schools admission tool brings information together to enable parents and carers to make better choices.

Read more about this and other projects . . .

Copyright © 2025 Data Unlocked · Map Image Copyright © OpenStreetMap contributors · Website by Fresh Eyes Consultancy