Data Unlocked

Bringing data to life

  • Home
  • About
  • Projects
  • Blog
  • Contact

Google Maps

March 12, 2018 By Mike Cummins Leave a Comment

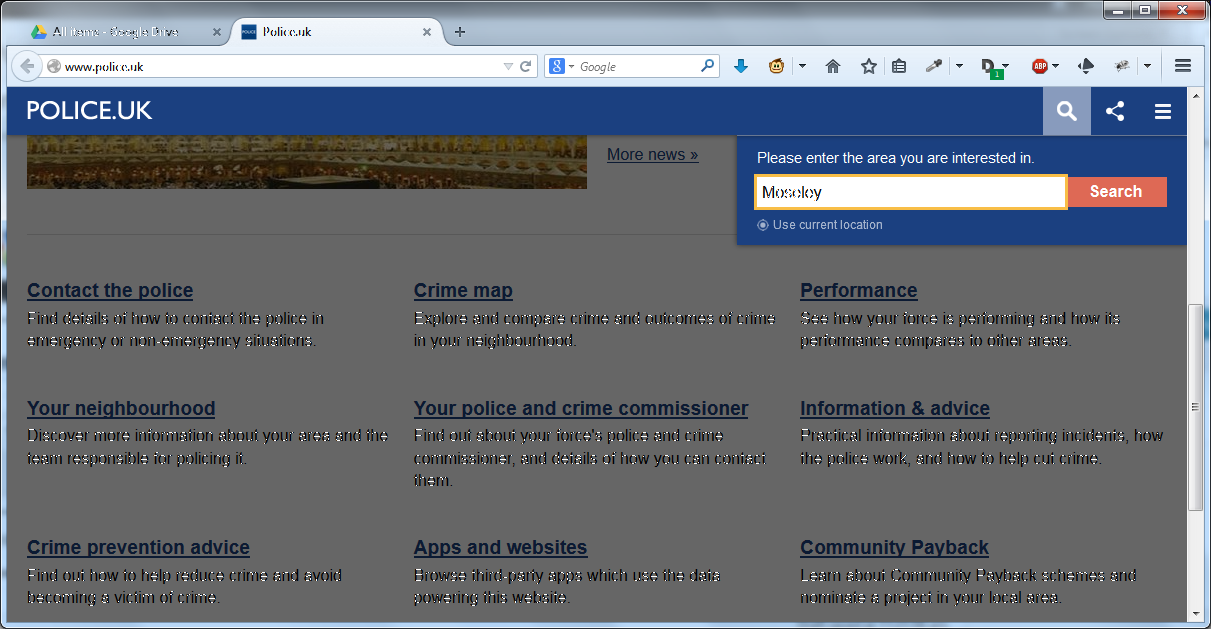
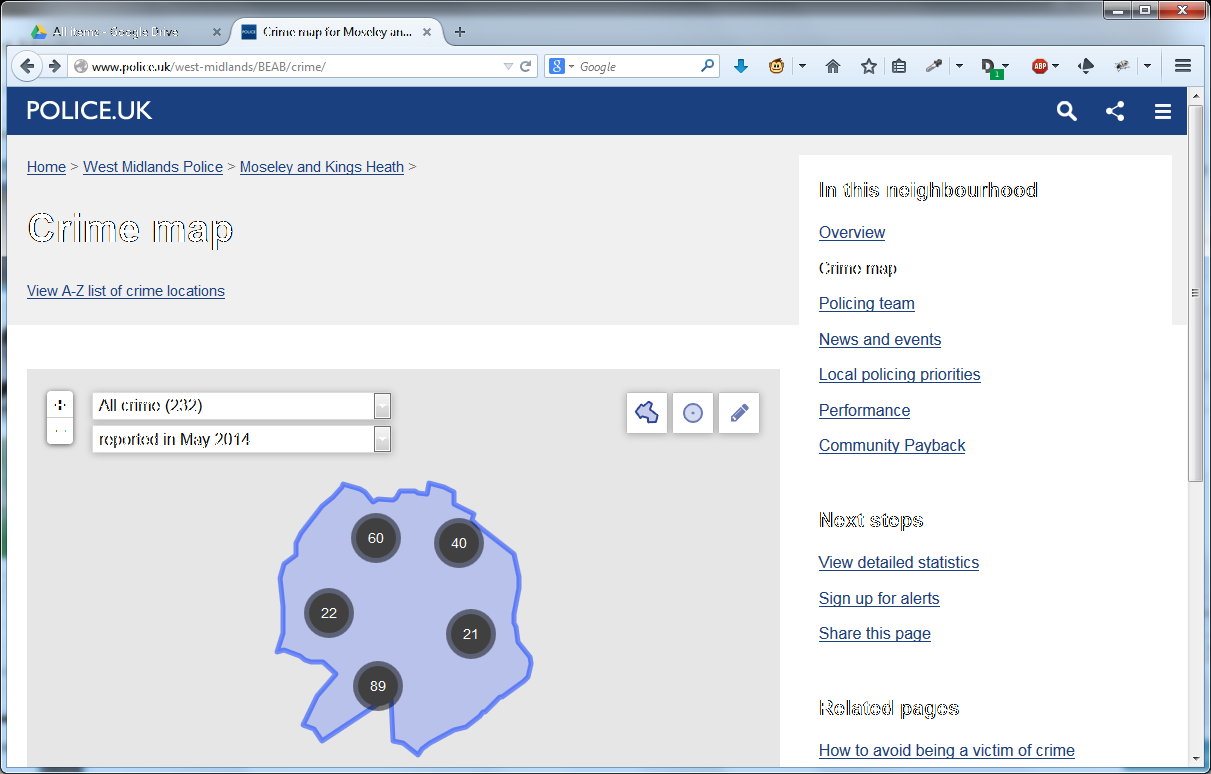
I recently wanted to present crime data for Moseley on a map – something I would normally do in Tableau, but wasn’t convenient at the time.

Having visited police.uk, entered a Moseley postcode and clicked “Explore the crime map”, I downloaded the data for the previous year to date by clicking “View detailed statistics and choosing the option to “download crime data for this area as a CSV file”.

I now had a file and remembered that an infrequently used part of Google Maps is to create your own map, albeit with a limit of 2,000 features.

–read more —

Having signed into Google, I went to Google Maps and clicked the 3 parallel horizontal bars that indicate a submenu.

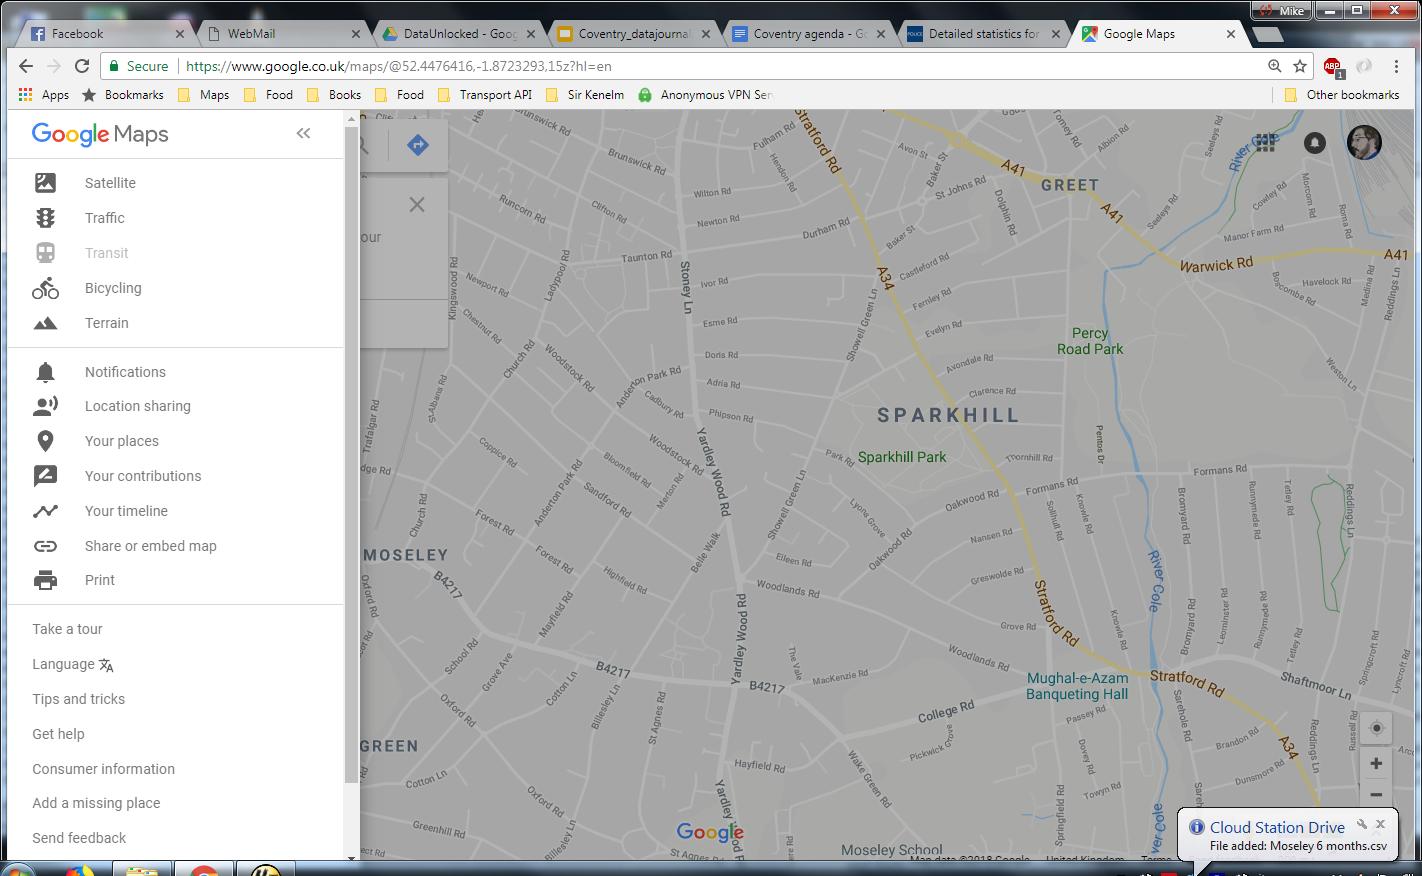
By clicking “Your places”, I was presented with maps that I had created in the past:

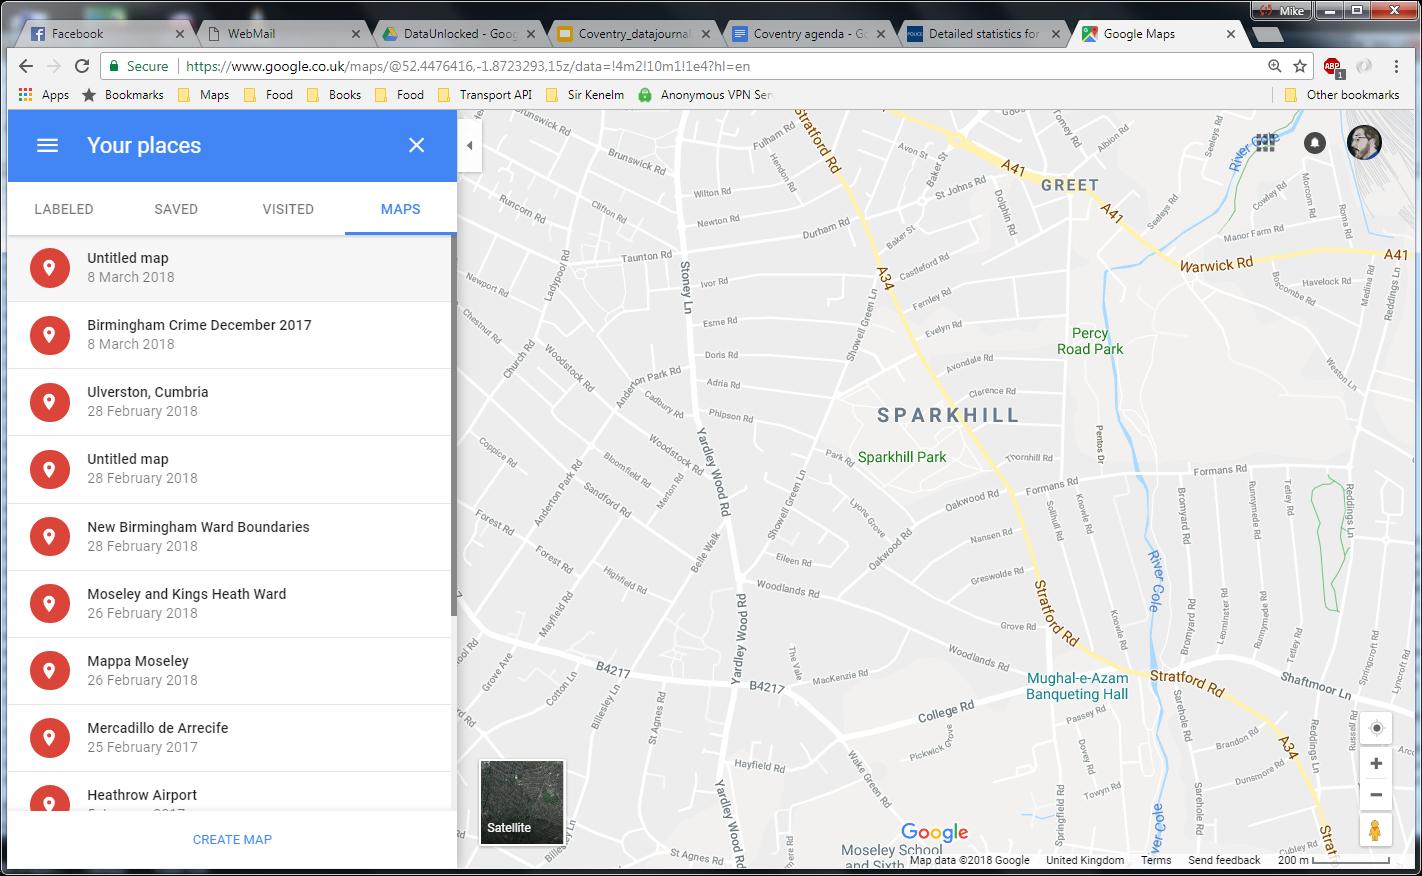
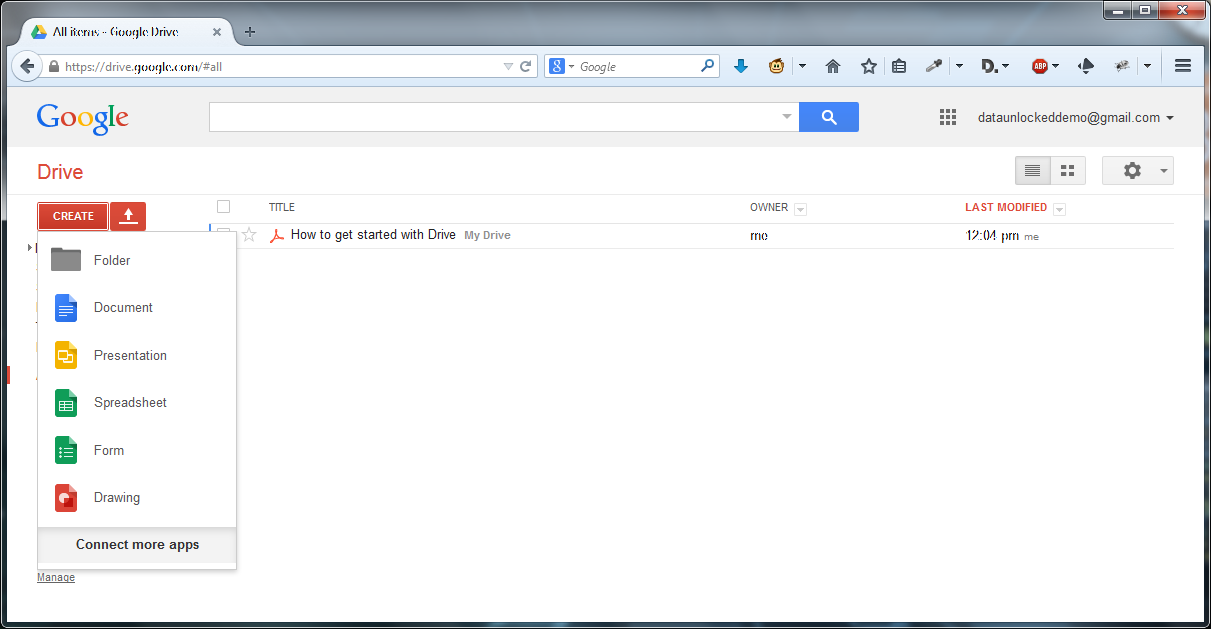
At the bottom of the list, there is an option to “CREATE MAP”, which I selected.

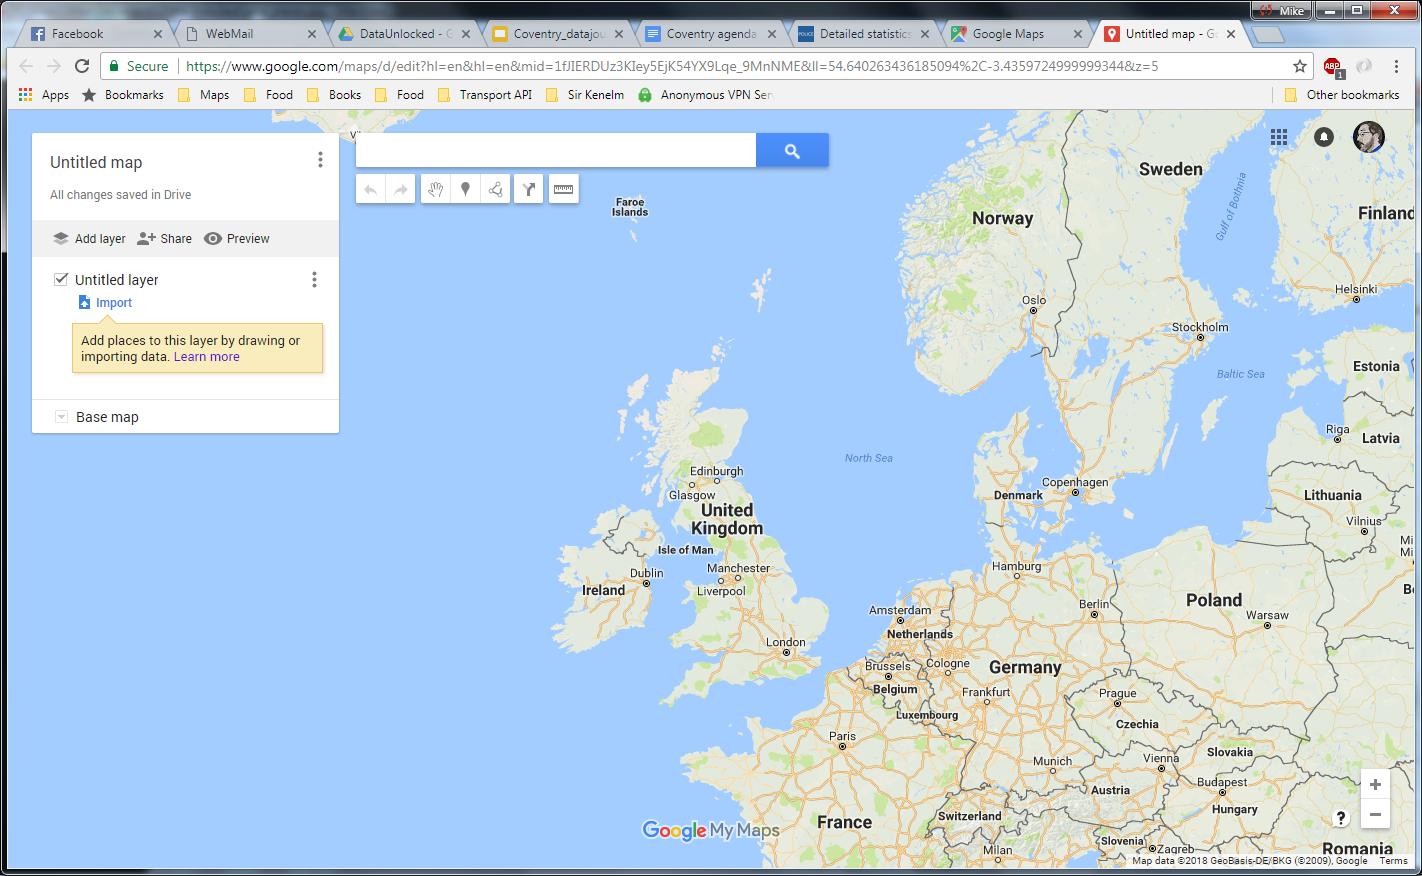
A clue is given to Import data onto a new (untitled) layer, which I selected.

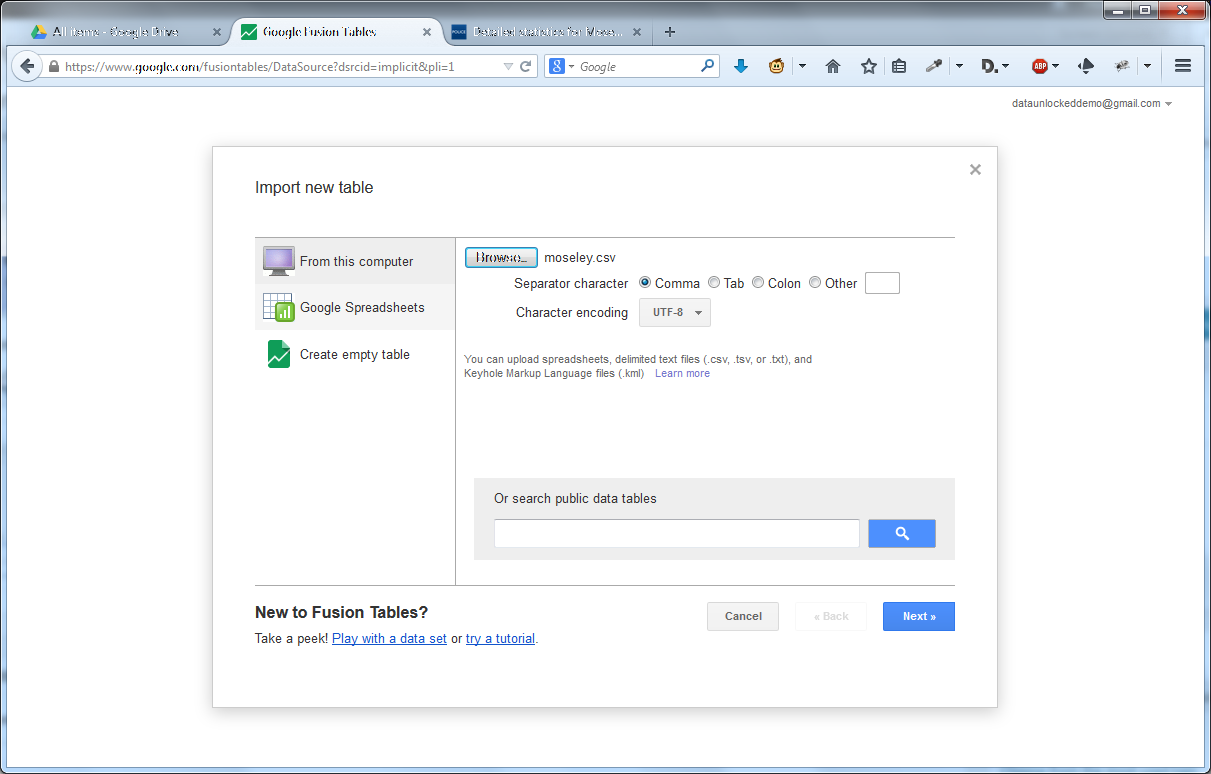
I uploaded my Moseley Crime Data to be asked which columns contained the Latitude and Longitude.  Fortunately, these columns had the same name and where already selected, so I clicked “Continue”.

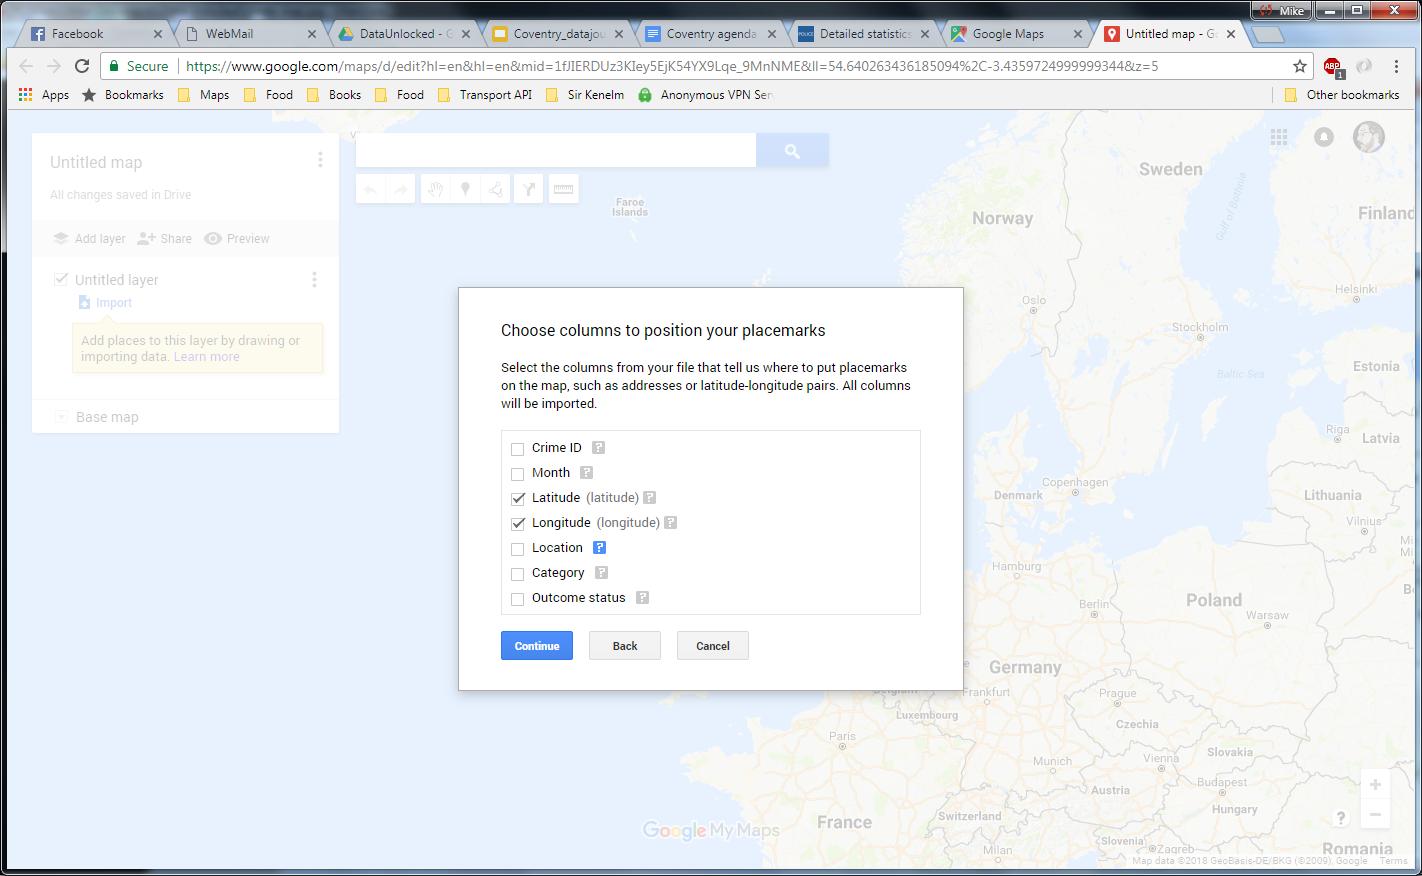
I was now asked to select a column to use as titles for my markers, selecting Category.

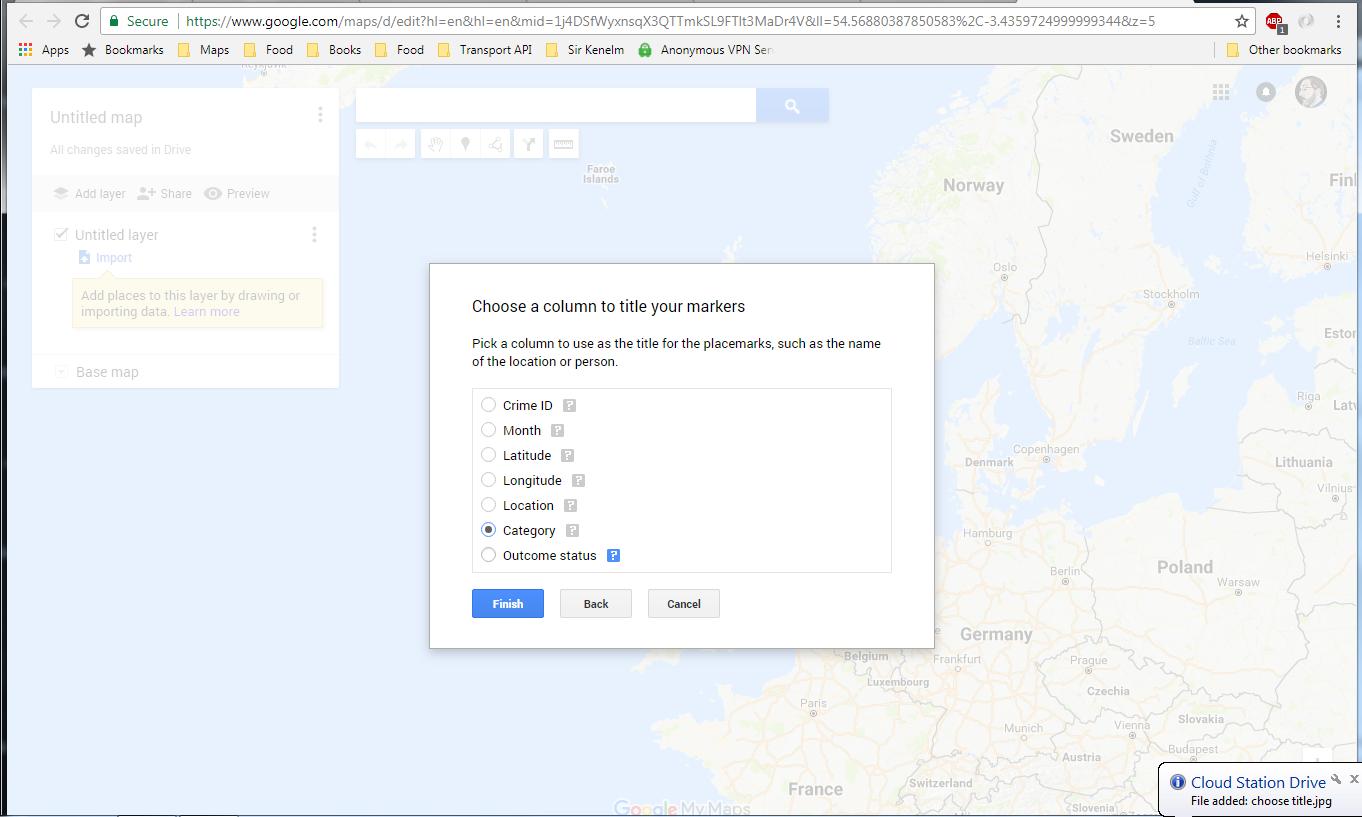
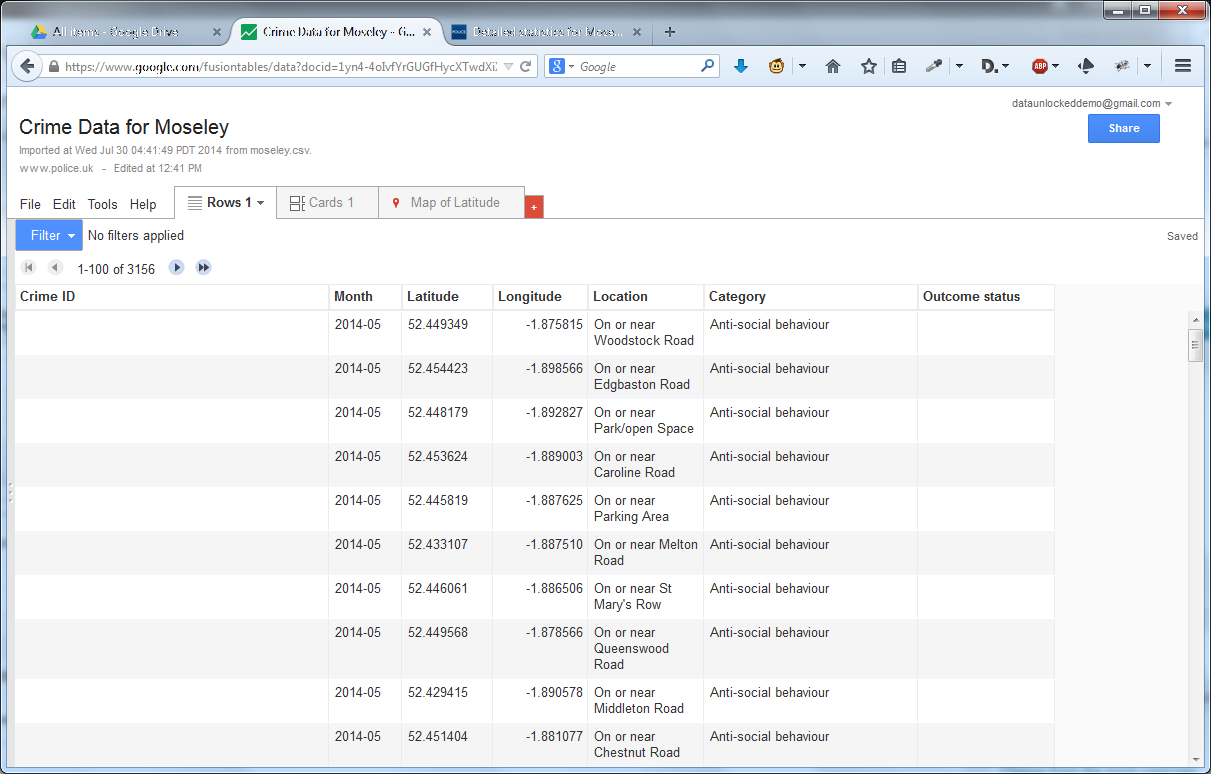
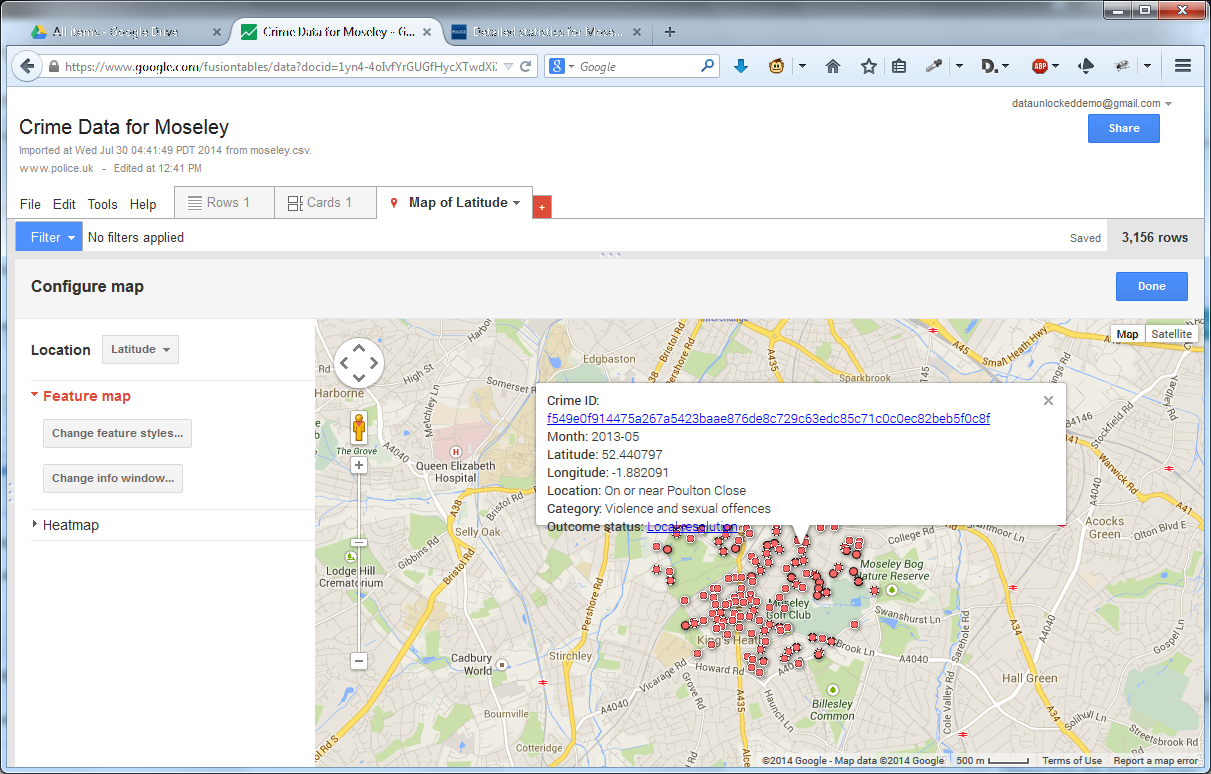
On clicking Finish I was presented with my map:

This is a bit boring, so I chose “Uniform style” and selected “Category which colour coded the pins by crime category:

So a quick and dirty colour coded map in about 3 minutes.


Creating and using embedded maps

August 11, 2014 By Mike Cummins Leave a Comment

This post will show you how to use Google Fusion Tables to create a map that can be embedded into your website.

Log in to Google Docs and click the Create button:
Click Create

Click “Connect more apps” at the bottom of the pop up and in the Search box type “Fusion Tables”:

connect more apps

Hit enter:
connect

Click Connect and then click OK.

Open a new browser window and go to http://www.police.uk. Look for and click Crime Map then, when prompted, enter the area or postcode you are interested in:

Area Moseley

On the following screen choose “View detailed statistics” on the right hand side:
View details statistics

Click “Download crime data for this area as a CSV file” and save the file somewhere you will remember.

Go back to Google Docs, click the Create button and then Fusion Tables. Click Browse and select your file:
browse

Then click Next. Depending on the size of your file, this may take some time but eventually a table will be presented. Check that the columns look correct and click Next.import new table

Now is a good time to give a proper name to your project then click Finish. You will be presented with a screen similar to this:
fusion table

Click the “Share” button on the top right, and choose “Anyone who has the link can view“.


visibility

Click Save, then Done.

Click the Map of Latitude tab and check that the data seems to be OK:
map

There are several things you can do now from choose what is displayed in the pop-up when you select a red dot to changing the red dot to something else. Explore.

When you have finished, click Tools then Publish:
publish

Change the height and width, then copy the part that starts “<iframe width=” to the clipboard.

Go to your favourite Content Management System – I am using WordPress.com as an example – and create a new post. Select the Text button, and paste in the “<iframe…” content you previously copied:
crime

Save your draft and click Preview:

preview


Contact Us

Many of our clients come to us with the words "there must be a way this can be done . . ."

We have found that there usually is!

Whether you have a problem that needs solving, or you just want to talk through some ideas, please get in touch.

Data Unlocked believes that a more equal society is a better society. We especially aim to work on projects that provide information to people and groups who might not usually be able to access it, so we are particularly interested in working with people who share these aims.

We are based in Birmingham, UK, but work nationally and internationally.

Email: hello@dataunlocked.co.uk

Twitter: @dataunlocked

Featured Project

Schools Finder

Our schools admission tool brings information together to enable parents and carers to make better choices.

Read more about this and other projects . . .

Copyright © 2025 Data Unlocked · Map Image Copyright © OpenStreetMap contributors · Website by Fresh Eyes Consultancy