Data Unlocked

Bringing data to life

  • Home
  • About
  • Projects
  • Blog
  • Contact

Share PSI workshop in Lisbon – call for papers

October 3, 2014 By Simon Whitehouse Leave a Comment

Following its first workshop on Samos during the summer, the Share PSI network are preparing for their second meeting in Lisbon. This will be 3-4 December at the National Laboratory for Civil Engineering.

The second workshop is entitled “Encouraging open data usage by commercial developers” which is a subject of some interest to Data Unlocked, and so I’m really pleased to be going there to represent Birmingham.

If you are interested in attending there are several ways in which you can participate:Continue Reading
Data Unlocked goes to Greece – Share PSI network report

September 15, 2014 By Simon Whitehouse 1 Comment

Share-PSI 2.0 is “the European network for the exchange of experience and ideas around implementing open data policies in the public sector”. It consists of 44 partners from 25 countries, including Birmingham City Council. Through my work with the West Midlands Open Data Forum I was invited by Digital Birmingham to attend the kick off meeting in April and then the recent workshop which formed part of this year’s Samos Summit.

The Share PSI Network Logo

The Share PSI Network

The Samos workshop had the title “Uses of open data within government for innovation and efficiency” and consisted of a wide range of presentations, a mini-bar camp and a project meeting. Amanda Smith from the Open Data Institute has already written a post about the workshop and an extensive report of the proceedings has been written up by Phil Archer, the project’s technical co-ordinator from the W3C.

So, instead of a report back, here are just four of the things I took away from the Samos workshop:Continue Reading

Creating and using embedded maps

August 11, 2014 By Mike Cummins Leave a Comment

This post will show you how to use Google Fusion Tables to create a map that can be embedded into your website.

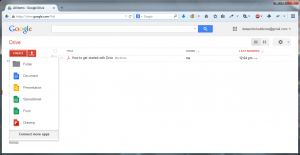
Log in to Google Docs and click the Create button:
Click Create

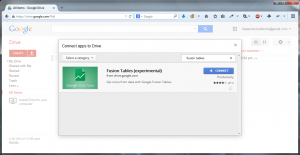
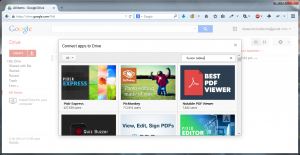
Click “Connect more apps” at the bottom of the pop up and in the Search box type “Fusion Tables”:

connect more apps

Hit enter:
connect

Click Connect and then click OK.

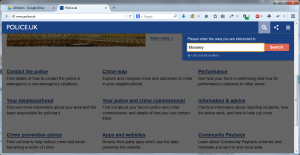
Open a new browser window and go to http://www.police.uk. Look for and click Crime Map then, when prompted, enter the area or postcode you are interested in:

Area Moseley

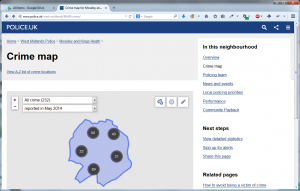
On the following screen choose “View detailed statistics” on the right hand side:
View details statistics

Click “Download crime data for this area as a CSV file” and save the file somewhere you will remember.

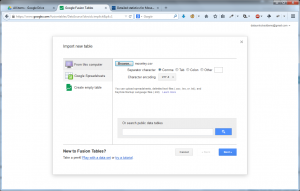
Go back to Google Docs, click the Create button and then Fusion Tables. Click Browse and select your file:
browse

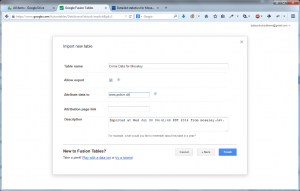
Then click Next. Depending on the size of your file, this may take some time but eventually a table will be presented. Check that the columns look correct and click Next.import new table

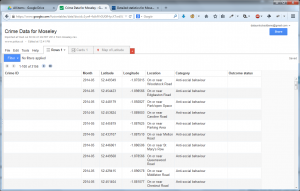
Now is a good time to give a proper name to your project then click Finish. You will be presented with a screen similar to this:
fusion table

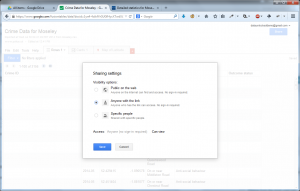
Click the “Share” button on the top right, and choose “Anyone who has the link can view“.


visibility

Click Save, then Done.

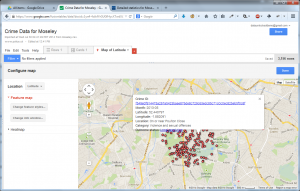
Click the Map of Latitude tab and check that the data seems to be OK:
map

There are several things you can do now from choose what is displayed in the pop-up when you select a red dot to changing the red dot to something else. Explore.

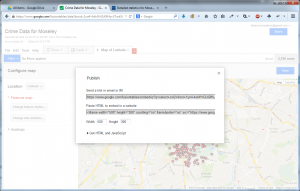
When you have finished, click Tools then Publish:
publish

Change the height and width, then copy the part that starts “<iframe width=” to the clipboard.

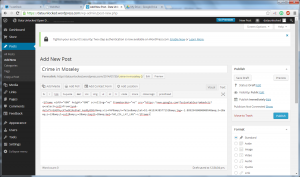
Go to your favourite Content Management System – I am using WordPress.com as an example – and create a new post. Select the Text button, and paste in the “<iframe…” content you previously copied:
crime

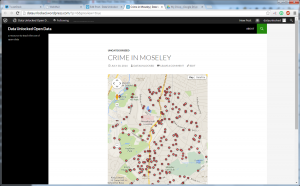
Save your draft and click Preview:

preview


Talking Open Data at #VCSSCamp

June 26, 2014 By Mike Cummins 1 Comment

I attended #VCSSCAMP – for people from VCS Local Infrastructure Organisations across the country to meet [that’s CVSs and Volunteer Centres etc] and what a bunch of enthusiastic people they are.

I was reminded by Nick Booth of just how important it is to tell people what you are doing now, not what you did or are going to do, thus this post[1].

There were several great sessions (look up the #hashtag or view the storify [to follow]), but I became most animated during the Open Data session – no surprise there.  This session had two main threads, the first detailing the sorts of things that can be done when you mix and match data that is open (I used the example of Birmingham Council spending over £500 to the Open Corporates data – including turnover) and a few more were mentioned that to prevent red faces on the targets I won’t mention.  The second thread was on how sharing your data can bring unforeseen benefits from people producing apps and mash-ups (linking the data in interested ways) to finding links to organisations that you would, at first thought, not have expected to be relevant.

A possible third thread nearly appeared – where do we find out how to do this? A topic that was touched on several times and specific questions were answered which (as the participants were so polite) were not really followed up. The ODI were mentioned, but not everyone can go to London to attend their events.  Those in the know did mention the West Midlands Open Data Forum, Open Mercia, the projects in Leeds, Manchester and Bristol but these are not really learn-how, more learn-with.

That said, this seems to be a recurrent theme across a lot of (un and) conferences I have been to recently and I normally answer with “There are a lot of tutorials out there” which is a non-answer. You would need to know what is possible, and what search terms to use, before you know how to find the tutorial.

Paul Bradshaw has done an excellent job with Hacks and Hackers of mixing people who want to know with people who know and I wonder if this system could or should be replicated outside of journalism to a wider audience – not just VCS but housing associations, uniformed groups (Scouts, St. John’s Ambulance etc) and others.

This leads me to wonder if there would be an appetite for an “Open Data 101” – what is Open Data, how do I use it and (hopefully) how do I open my data.  If there is enough interest, I would be willing to see if anyone (maybe RnR , the ODI or even Data Unlocked) could put something together in your area. This would (ideally) be from [boring] “I know nothing” to [fascinating] “Hey! Who knew?” over a series and would maybe involve setting something like a hangout up (Google+) to enable the participants to help each other as they explore their new skills. Maybe bring in people like Paul Bradshaw, Dave Harte and Nick Booth who can explain how to turn your wow-factor into something that a local paper will use…

*1 I would like to blame coffee for this blog post, but it is probably more the enthusiasm hormones from today.

West Midlands European Elections 2014

June 3, 2014 By Mike Cummins 1 Comment

Last week we collected and visualised the data for the local elections. To be complete, we have now scraped the European election results and made a Tableau visualisation of them.

The electoral process is different for the European Elections, as it is a form of Proportional Representation. Also, the results are more widely scattered on the map, this makes it more difficult to visualise and I think this makes it less clear than the Local Elections.

One thing I’ve added is a table showing the percentage of the vote per party for each of the electoral areas on the map. Because the numbers of people voting varies so much across areas this table is probably the best for seeing where particular parties are strongest. See if you can guess where UKIP got the highest proportion of votes in the West Midlands…..

If I get time, it would be nice to code the maps with LeafletJS as it has better panning. If you click and hold on the map below for a couple of seconds you will, eventually, be able to move the map around.

As for the local elections, the raw data is stored in the Open Data West Midlands Store.

Learn About Tableau

Birmingham Local Elections 2014

May 29, 2014 By Mike Cummins Leave a Comment

I was fortunate to be able to see the count for Birmingham Local Elections this year (thank you @bccnewsroom).

Birmingham Council were very quick to publish the results on their web page, but unfortunately they did this using tables. That doesn’t make it terribly easy for anybody to come along, grab the data and reuse it in any way.

So, I wrote a quick scraper and collected the data into a CSV file which I placed in the West Midlands Open Datastore. By doing this it means that anybody can take that file, import it into another programme, such as spreadsheet software, and do some analysis on it.

I decided to use Tableau to create a quick visualisation, which you can see below. Each pie chart shows the breakdown of votes cast in the ward with the size of the pie chart determined by the total number of votes cast in the ward.


Learn About Tableau


The data visualisation guru, @CarolineBeavon has kindly added a much more user friendly view:

Learn About Tableau

If you select a party from the drop down box at the top, the map on the left will update to show you where they received their votes. The map on the right shows which party won in each ward across the city.

Further down (you may need to scroll) on the left is a breakdown of the votes cast in each ward and on the right the total number of votes cast for each party across the city.

Creating a visualisation that helps people explore election results isn’t easy. We hope what we’ve done is useful and welcome suggestions of other ways that it might be done.

Four interesting facts about school admissions in Birmingham

May 20, 2014 By Simon Whitehouse 2 Comments

According to The Guardian, this year 70.3% of Birmingham parents/carers “won” a place for their child at their first place secondary school. That’s a pretty good percentage, although it is apparently down by 3% on last year.

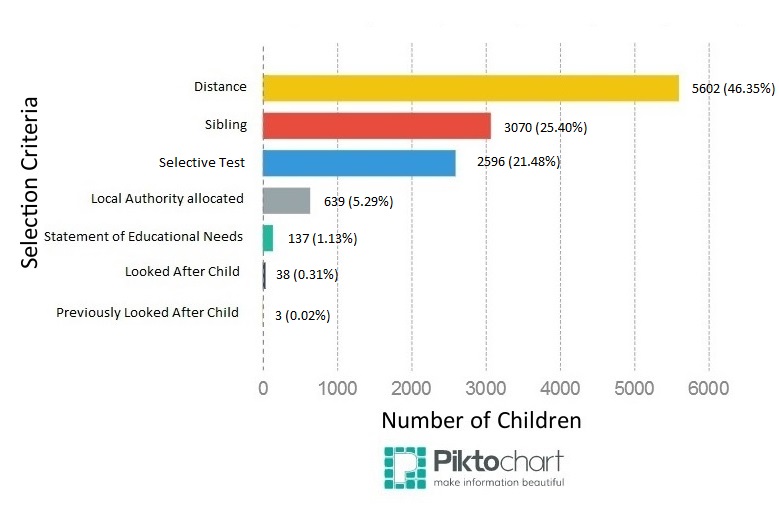
At Data Unlocked we’ve being doing work on school admissions, especially in Birmingham, for a number of years now. Following a recent Freedom of Information request we have been able to break down how children from Birmingham get into Birmingham secondary schools, based on the selection criteria.

Birmingha School Admissions

Birmingham Secondary School Admissions, by criteria, 2013

To clarify: this is children in Birmingham who are offered a place at a Birmingham secondary school. Children from outside Birmingham and Birmingham children who travel to school outside Birmingham, aren’t included in these figures.

From this, we’ve pulled out four interesting facts, or observations:Continue Reading

West Midlands Open Data Store

March 5, 2014 By Simon Whitehouse 2 Comments

The Saturday before last, myself and Mike from Data Unlocked were at the Open Data Day event at Birmingham City University (BCU) which was run by Andrew MacKenzie and Pauline Roche of Open Mercia. Here we attempted to establish “An Open Data Store in a Day”. The reason for this was because we wanted to experiment with a community run site that published and linked to open data across multiple organisations.

I did some preparatory work so that we had an instance of Ckan up and running in time for the start at 10am. By the end of the day we have over 50 resources loaded up to the store. This included such datasets as the last 10 years of grants that the BIG Lottery Fund have made in the West Midlands and the Joint Industry Committee for Regional Media Research’s newspaper circulation figures across the region.

openDataDayByJuliaHigginbottom

Continue Reading

« Previous Page

Contact Us

Many of our clients come to us with the words "there must be a way this can be done . . ."

We have found that there usually is!

Whether you have a problem that needs solving, or you just want to talk through some ideas, please get in touch.

Data Unlocked believes that a more equal society is a better society. We especially aim to work on projects that provide information to people and groups who might not usually be able to access it, so we are particularly interested in working with people who share these aims.

We are based in Birmingham, UK, but work nationally and internationally.

Email: hello@dataunlocked.co.uk

Twitter: @dataunlocked

Featured Project

Schools Finder

Our schools admission tool brings information together to enable parents and carers to make better choices.

Read more about this and other projects . . .

Copyright © 2025 Data Unlocked · Map Image Copyright © OpenStreetMap contributors · Website by Fresh Eyes Consultancy