Data Unlocked

Bringing data to life

  • Home
  • About
  • Projects
  • Blog
  • Contact

Birmingham School Admissions – 2014

October 9, 2014 By Simon Whitehouse Leave a Comment

For the past couple of years Data Unlocked have produced a tool to help parents and carers applying for school places for their children in the following year.

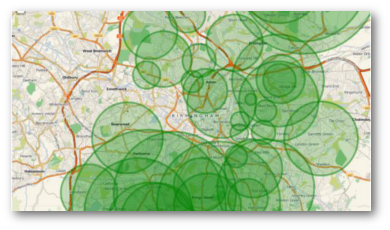
It allows you to put your address or post code in and from that it will create a map showing the cut off distances for schools in your area over the previous years. While it can’t tell you for definite that you will or won’t be successful, it helps parents in their decision making by giving an indication of recent trends. You can go to the map by clicking on the image below.

Birmingham-Secondary-Schools-Finder

Continue Reading

West Midlands European Elections 2014

June 3, 2014 By Mike Cummins 1 Comment

Last week we collected and visualised the data for the local elections. To be complete, we have now scraped the European election results and made a Tableau visualisation of them.

The electoral process is different for the European Elections, as it is a form of Proportional Representation. Also, the results are more widely scattered on the map, this makes it more difficult to visualise and I think this makes it less clear than the Local Elections.

One thing I’ve added is a table showing the percentage of the vote per party for each of the electoral areas on the map. Because the numbers of people voting varies so much across areas this table is probably the best for seeing where particular parties are strongest. See if you can guess where UKIP got the highest proportion of votes in the West Midlands…..

If I get time, it would be nice to code the maps with LeafletJS as it has better panning. If you click and hold on the map below for a couple of seconds you will, eventually, be able to move the map around.

As for the local elections, the raw data is stored in the Open Data West Midlands Store.

Learn About Tableau

Birmingham Local Elections 2014

May 29, 2014 By Mike Cummins Leave a Comment

I was fortunate to be able to see the count for Birmingham Local Elections this year (thank you @bccnewsroom).

Birmingham Council were very quick to publish the results on their web page, but unfortunately they did this using tables. That doesn’t make it terribly easy for anybody to come along, grab the data and reuse it in any way.

So, I wrote a quick scraper and collected the data into a CSV file which I placed in the West Midlands Open Datastore. By doing this it means that anybody can take that file, import it into another programme, such as spreadsheet software, and do some analysis on it.

I decided to use Tableau to create a quick visualisation, which you can see below. Each pie chart shows the breakdown of votes cast in the ward with the size of the pie chart determined by the total number of votes cast in the ward.


Learn About Tableau


The data visualisation guru, @CarolineBeavon has kindly added a much more user friendly view:

Learn About Tableau

If you select a party from the drop down box at the top, the map on the left will update to show you where they received their votes. The map on the right shows which party won in each ward across the city.

Further down (you may need to scroll) on the left is a breakdown of the votes cast in each ward and on the right the total number of votes cast for each party across the city.

Creating a visualisation that helps people explore election results isn’t easy. We hope what we’ve done is useful and welcome suggestions of other ways that it might be done.

Four interesting facts about school admissions in Birmingham

May 20, 2014 By Simon Whitehouse 2 Comments

According to The Guardian, this year 70.3% of Birmingham parents/carers “won” a place for their child at their first place secondary school. That’s a pretty good percentage, although it is apparently down by 3% on last year.

At Data Unlocked we’ve being doing work on school admissions, especially in Birmingham, for a number of years now. Following a recent Freedom of Information request we have been able to break down how children from Birmingham get into Birmingham secondary schools, based on the selection criteria.

Birmingha School Admissions

Birmingham Secondary School Admissions, by criteria, 2013

To clarify: this is children in Birmingham who are offered a place at a Birmingham secondary school. Children from outside Birmingham and Birmingham children who travel to school outside Birmingham, aren’t included in these figures.

From this, we’ve pulled out four interesting facts, or observations:Continue Reading

Contact Us

Many of our clients come to us with the words "there must be a way this can be done . . ."

We have found that there usually is!

Whether you have a problem that needs solving, or you just want to talk through some ideas, please get in touch.

Data Unlocked believes that a more equal society is a better society. We especially aim to work on projects that provide information to people and groups who might not usually be able to access it, so we are particularly interested in working with people who share these aims.

We are based in Birmingham, UK, but work nationally and internationally.

Email: hello@dataunlocked.co.uk

Twitter: @dataunlocked

Featured Project

Schools Finder

Our schools admission tool brings information together to enable parents and carers to make better choices.

Read more about this and other projects . . .

Copyright © 2025 Data Unlocked · Map Image Copyright © OpenStreetMap contributors · Website by Fresh Eyes Consultancy