Data Unlocked

Bringing data to life

  • Home
  • About
  • Projects
  • Blog
  • Contact

How to Estimate the diagnosis of health conditions in England

September 10, 2018 By Mike Cummins Leave a Comment

Simon has explained what we wanted to do with QOF in the previous post.

Looking at the prevalence data from the QOF files, we see the GP Code, the Indicator Group (the health condition this relates to), the number of patients on that GP’s register that have that condition, the list type and list size.

These last two fields are important – not all conditions are measured across all ages: in the example below, Chronic Kidney Disease is only counted for people over 18.

gp_code Indicator_group register patient_list_type list_size
AGP001 AF 100 TOTAL 1000
AGP001 AST 300 TOTAL 1000
AGP001 CKD 125 18OV 800

Continue Reading

Estimating the diagnosis of health conditions in England

September 4, 2018 By Simon Whitehouse 1 Comment

Data Unlocked are working on a project with Inside Outcomes and Birmingham City University to estimate the rate of diagnosis of over twenty health conditions in England using openly available datasets. In this blog post Simon Whitehouse explains how we have made our estimations.

Earlier this year we spoke with Darren Wright of Inside Outcomes about the possibility of estimating the diagnosis of health conditions in England by area, something we were surprised wasn’t already available.

The National Health Service (NHS) do produce statistics, called Quality Outcome Framework (QOF) measures, that break down the prevalence of diagnosis of twenty five different health conditions from Atrial Fibrillation to Stroke, by GP practice.

Pre-Existing Condition - The Noun Project

They also produce statistics about the number of patients registered in GPs practices, broken down by the Lower Layer Super Output Area (LSOA) they live in.Continue Reading

Google Maps

March 12, 2018 By Mike Cummins Leave a Comment

I recently wanted to present crime data for Moseley on a map – something I would normally do in Tableau, but wasn’t convenient at the time.

Having visited police.uk, entered a Moseley postcode and clicked “Explore the crime map”, I downloaded the data for the previous year to date by clicking “View detailed statistics and choosing the option to “download crime data for this area as a CSV file”.

I now had a file and remembered that an infrequently used part of Google Maps is to create your own map, albeit with a limit of 2,000 features.

–read more —

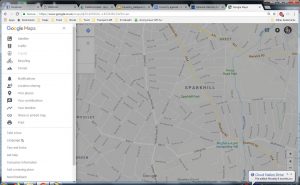
Having signed into Google, I went to Google Maps and clicked the 3 parallel horizontal bars that indicate a submenu.

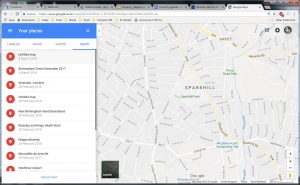
By clicking “Your places”, I was presented with maps that I had created in the past:

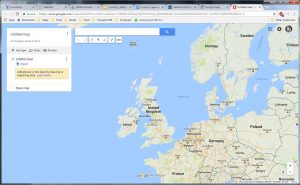
At the bottom of the list, there is an option to “CREATE MAP”, which I selected.

A clue is given to Import data onto a new (untitled) layer, which I selected.

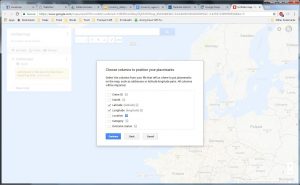
I uploaded my Moseley Crime Data to be asked which columns contained the Latitude and Longitude.  Fortunately, these columns had the same name and where already selected, so I clicked “Continue”.

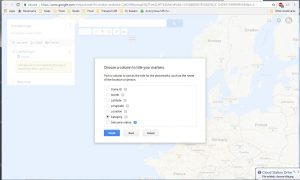
I was now asked to select a column to use as titles for my markers, selecting Category.

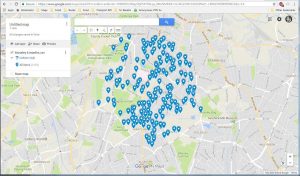
On clicking Finish I was presented with my map:

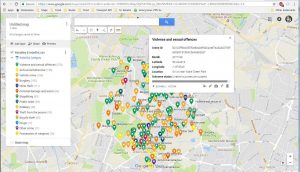
This is a bit boring, so I chose “Uniform style” and selected “Category which colour coded the pins by crime category:

So a quick and dirty colour coded map in about 3 minutes.


Open Data Camp – Data as Art session

November 2, 2017 By Simon Whitehouse Leave a Comment

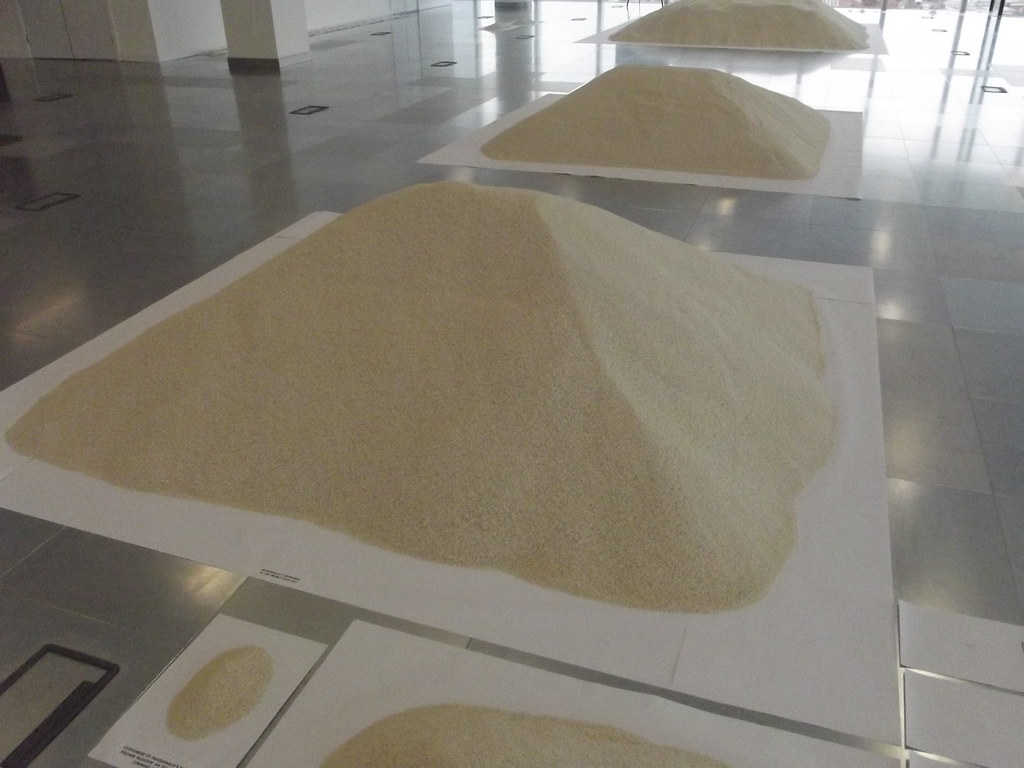
Of all the people in the world - Stan's Cafe - Two Snowhill

Myself and Mike Cummins went to Belfast the other weekend for Open Data Camp 5. The following is a write up and some thoughts about the session that Amy Evans from Open Data Institute (ODI) Leeds ran on Open Data and Art.

The Session: Open Data As Art

Amy started by introducing herself. She is the social media and communications lead at ODI Leeds as well as being their go to person for visual work. She has a background in Visual Communication, specifically Illustration.

Amy highlighted the Big Bang Data exhibition at Somerset House as being an example of open data art and said that her interest in running the session was to discover other examples.Continue Reading

Open Data Standards – School Admissions

October 20, 2017 By Simon Whitehouse Leave a Comment

Birmingham School Finder

Data Unlocked have long had our Schools Finder project that aims to improve the school admissions process here in Birmingham.

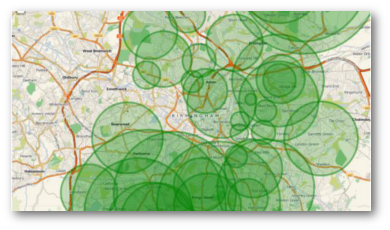
It allows you to put your address or post code in and from that it will create a map showing the cut off distances for schools in your area over the previous years. While it can’t tell you for definite that you will or won’t be successful, it helps parents and carers in their decision making by giving an indication of recent trends.

We are currently updating the Birmingham School Finder, so apologies for not being able to link to a live example, our current working copy has data up to 2014 and includes historic trends. It covers both primary and secondary school admissions.

Birmingham-Secondary-Schools-Finder

As part of this work we have written a series of Freedom of Information (FoI) requests. We did this after reading and using a fair few local authority school admission documents, comparing the information they contained.Continue Reading

Birmingham School Admissions – 2014

October 9, 2014 By Simon Whitehouse Leave a Comment

For the past couple of years Data Unlocked have produced a tool to help parents and carers applying for school places for their children in the following year.

It allows you to put your address or post code in and from that it will create a map showing the cut off distances for schools in your area over the previous years. While it can’t tell you for definite that you will or won’t be successful, it helps parents in their decision making by giving an indication of recent trends. You can go to the map by clicking on the image below.

Birmingham-Secondary-Schools-Finder

Continue Reading

Share PSI workshop in Lisbon – call for papers

October 3, 2014 By Simon Whitehouse Leave a Comment

Following its first workshop on Samos during the summer, the Share PSI network are preparing for their second meeting in Lisbon. This will be 3-4 December at the National Laboratory for Civil Engineering.

The second workshop is entitled “Encouraging open data usage by commercial developers” which is a subject of some interest to Data Unlocked, and so I’m really pleased to be going there to represent Birmingham.

If you are interested in attending there are several ways in which you can participate:Continue Reading

Data Unlocked goes to Greece – Share PSI network report

September 15, 2014 By Simon Whitehouse 1 Comment

Share-PSI 2.0 is “the European network for the exchange of experience and ideas around implementing open data policies in the public sector”. It consists of 44 partners from 25 countries, including Birmingham City Council. Through my work with the West Midlands Open Data Forum I was invited by Digital Birmingham to attend the kick off meeting in April and then the recent workshop which formed part of this year’s Samos Summit.

The Share PSI Network Logo

The Share PSI Network

The Samos workshop had the title “Uses of open data within government for innovation and efficiency” and consisted of a wide range of presentations, a mini-bar camp and a project meeting. Amanda Smith from the Open Data Institute has already written a post about the workshop and an extensive report of the proceedings has been written up by Phil Archer, the project’s technical co-ordinator from the W3C.

So, instead of a report back, here are just four of the things I took away from the Samos workshop:Continue Reading

Creating and using embedded maps

August 11, 2014 By Mike Cummins Leave a Comment

This post will show you how to use Google Fusion Tables to create a map that can be embedded into your website.

Log in to Google Docs and click the Create button:
Click Create

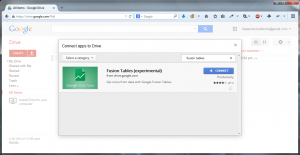
Click “Connect more apps” at the bottom of the pop up and in the Search box type “Fusion Tables”:

connect more apps

Hit enter:
connect

Click Connect and then click OK.

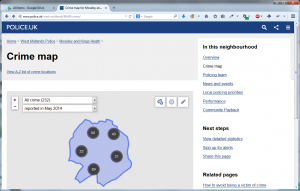
Open a new browser window and go to http://www.police.uk. Look for and click Crime Map then, when prompted, enter the area or postcode you are interested in:

Area Moseley

On the following screen choose “View detailed statistics” on the right hand side:
View details statistics

Click “Download crime data for this area as a CSV file” and save the file somewhere you will remember.

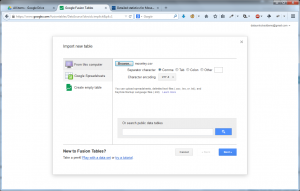
Go back to Google Docs, click the Create button and then Fusion Tables. Click Browse and select your file:
browse

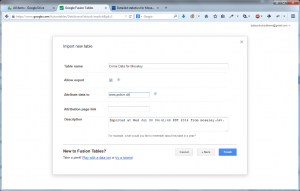
Then click Next. Depending on the size of your file, this may take some time but eventually a table will be presented. Check that the columns look correct and click Next.import new table

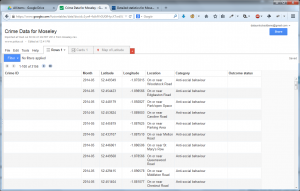
Now is a good time to give a proper name to your project then click Finish. You will be presented with a screen similar to this:
fusion table

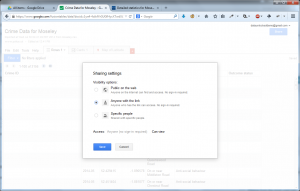
Click the “Share” button on the top right, and choose “Anyone who has the link can view“.


visibility

Click Save, then Done.

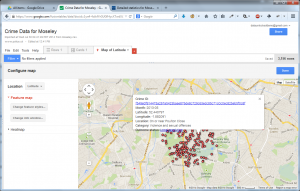
Click the Map of Latitude tab and check that the data seems to be OK:
map

There are several things you can do now from choose what is displayed in the pop-up when you select a red dot to changing the red dot to something else. Explore.

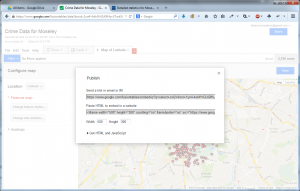
When you have finished, click Tools then Publish:
publish

Change the height and width, then copy the part that starts “<iframe width=” to the clipboard.

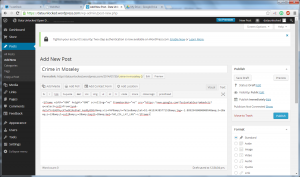
Go to your favourite Content Management System – I am using WordPress.com as an example – and create a new post. Select the Text button, and paste in the “<iframe…” content you previously copied:
crime

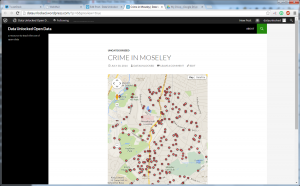
Save your draft and click Preview:

preview


A Modest Proposal for an API to query planning data

July 14, 2014 By Mike Cummins 8 Comments

We have recently been looking at Planning Application data and how it could best be accessed by programmers to create their own displays or to create plug-ins for Word Press etc.

As such, this is a sort of Request For Comments to find out if we are thinking on the right lines and whether we have missed any vital functionality.

An API implemented as a standard JSON web service using HTTP GET and POST requests.

Last Application:

eg /api/api.php?lastapplication

Returns :

{
   "Date": "2014-03-31"
}

Authorities held
eg /api/authorities

Returns :

[
{
   "Authority": "Birmingham",
   "Count": 2567
},
...
]

By Application number

eg /api/api.php?Birmingham&application=2014/01632/PAContinue Reading

Next Page »

Contact Us

Many of our clients come to us with the words "there must be a way this can be done . . ."

We have found that there usually is!

Whether you have a problem that needs solving, or you just want to talk through some ideas, please get in touch.

Data Unlocked believes that a more equal society is a better society. We especially aim to work on projects that provide information to people and groups who might not usually be able to access it, so we are particularly interested in working with people who share these aims.

We are based in Birmingham, UK, but work nationally and internationally.

Email: hello@dataunlocked.co.uk

Twitter: @dataunlocked

Featured Project

Schools Finder

Our schools admission tool brings information together to enable parents and carers to make better choices.

Read more about this and other projects . . .

Copyright © 2025 Data Unlocked · Map Image Copyright © OpenStreetMap contributors · Website by Fresh Eyes Consultancy